Chantal Claud: Polar low « le cygne » : Satellite observations and numerical simulations
Laboratoire de Météorologie Dynamique, Ecole Polytechnique, Palaiseau, France
G. Heinemann, Meteorologisches Institut Universität Bonn, Bonn, Germany
E. Raustein, Department of Meteorology, Geophysical Institute, University of Bergen, Norway
L. McMurdie, Department of Atmospheric Sciences, University of Washington, Seattle, WA. USA
Abstract
A polar low (PL) which occurred in October 1993 over the Norwegian Sea (NWS) is investigated from an observational and a numerical point of view. This polar low has several unique features : it developed early in the season, it lasted for about 3 days, and its trajectory was such that it passed over weather stations, so that « conventional » observations of the low are available. The conditions of the polar low formation, development and decay are investigated using a double approach: satellite data from several instruments are used together to document the mesoscale structure of the low, and two versions of a Limited Area Model (LAM) are run to investigate the dynamics of the low. Model fields are compared to quantities derived from TOVS, SSM/I and satellite radar altimeter data. In spite of a better spatial resolution of the models, humidity and surface wind speeds are less organized in the simulations than in satellite retrievals. The number of vertical levels, especially for the lowest layers of the atmosphere, appears to be an essential component for a good simulation of the trajectory of the low. There is however a good overall agreement between modelled and satellite-derived fields, and the good quality of the simulations allows inferences about the essential physical and dynamical processes taking place during the formation and development of the polar low. We find that the polar low was the result of favourable flow conditions at the surface, in the form of a shallow arctic front established south of the ice edge, together with an upper-level PV anomaly setting the stage for a positive interaction. Later on, the strong surface sensible and latent heat fluxes contributed to the extensive vertical development. This study demonstrates the usefulness of the approach adopted here which relies not only on simulations but also on observations to get a very complete description of such disturbances.
1. Introduction
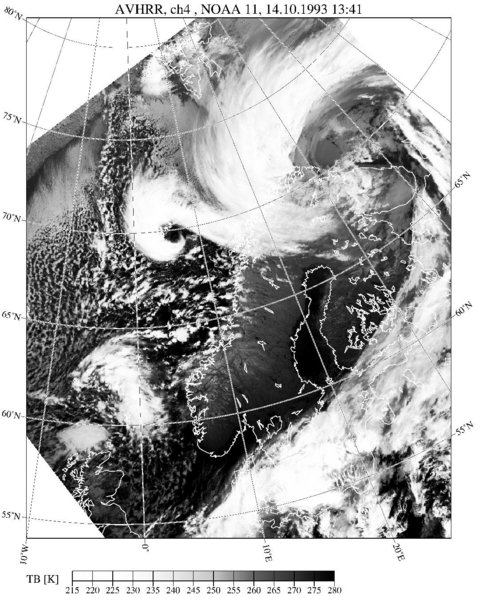
The current paper investigates a PL case called « le Cygne » (the swan, after the appearance on the satellite imagery, see Fig.1), which formed early on 14 October at around 72°N, 5-10°E to the rear of a synoptic-scale cyclone. The PL moved southwards almost parallel to the Norwegian coast with a speed of about 10 m/s, before decaying over Southern Norway on 16 October. Significant changes in cloud structure occurred during its lifetime with the evolution from a so-called «comma-cloud» to a spiraliform polar low, suggesting that during the growth of the PL, the ongoing mechanisms changed. This particular PL case discussed in this paper was previously simulated using the HIRLAM (High-Resolution Limited Area Model) model by Nielsen (1997) (referred to as N97 hereafter). The main conclusion of that work was that this low initially formed by baroclinic instability along a frontal zone within a maritime polar air mass and that latent heat fluxes were necessary for the PL formation. One of the conclusions of N97 was that it was desirable to consider satellite data to get detailed information about the three-dimensional dynamic and thermodynamic structure of the PL and to compare them with model simulations. The present study indeed gives new insights into this PL development through a multi-sensor satellite data investigation and its simulation by two versions of a mesoscale model. The model is the Norwegian Limited Area model (NORLAM) developed at the Norwegian Meteorological Institute (Grønås et al., 1987). In contrast to N97, we focus on the genesis stage of the PL, and started the simulations 12h earlier. While N97 analyzed the PL development using the quasi-geostrophic theory, we use the isentropic potential vorticity (IPV) theory in the current paper.Satellite imagery (AVHRR) and retrievals (TOVS, SSM/I, Topex-Poseidon satellite altimeter) are used for description of the PL, but also serve to validate the model simulations by comparing them with satellite-retrieved fields. The full paper on this PL cases is in review (Claud et al., 2004).
2. Numerical models and satellite data
2.1 Atmospheric models
The models used in this study are based on the Norwegian Limited Area model (NORLAM) developed at the Norwegian Meteorological Institute (DNMI) (Grønås et al., 1987), which is a full physics hydrostatic primitive equation model on a polarstereographic map with the sigma-coordinate as the vertical reference frame.The model version used at the University of Bonn is the NORLAM (version 9), which is run with a resolution of 97 by 121 horizontal grid points and 30 vertical sigma levels with the model top at 100 hPa. About half the levels are located below 850 hPa in order to resolve the boundary layer well. Runs with 25 km grid spacing (LAM25) are performed with lateral boundaries provided by 6-hourly ECMWF analyses (with a spatial resolution of 1.125° latitude x 1.125° longitude for this study). The model domain is 2500 km by 3000 km. A detailed description of the model setup can be found e.g. in Klein and Heinemann (2002).
The model version used at the University of Bergen (NORLAMS) is basically the same as NORLAM. The difference is that whereas in NORLAM cloud water is a diagnostic variable, in NORLAMS cloud water is treated as a prognostic variable (Sundqvist scheme, Kvamstø, 1992). The integration area and the number of horizontal grid points are the same as for the University of Bonn version; however, the number of vertical sigma levels is 18 with 5 levels below 850 hPa. For the initialization and 6-hourly boundary values, the same ECMWF analyses as described above are used.
2.2 Satellite data
NOAA11 AVHRR (Advanced Very High-Resolution Radiometer) data with a nadir resolution of 1.1 km is used, which yields an overpass over the NWS every 12 hours (at approximately 05 and 14 UTC). For investigating the atmospheric environment of the polar low in terms of temperature, TIROS-N Operational Vertical Sounder (TOVS) observations have been used. Measured spectral radiances are converted into atmospheric variables using the Improved Initialization Inversion (3I) algorithm (e.g. Chedin and Scott, 1985) with a horizontal resolution of 100 km by 100 km. Special Sensor Microwave/ Imager (SSM/I) data are used for the retrieval of fields of integrated water vapor (IWV), integrated cloud liquid water content (ICLW), surface wind speed (WS), scattering by large ice particles (S85) with a resolution of about 50 km. The Topex-Poseidon nadir-viewing satellite altimeter allows the retreival of the wind speed and the significant wave height (SWH) at a 10km resolution.
3. Results
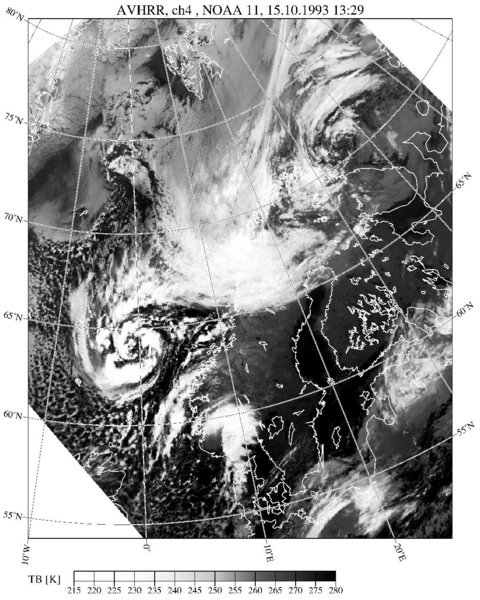
As early as on 14 October at 0727 UTC, wind speeds exhibit the classical couplet of low winds in the center of the polar low and strong winds to the west. This tendency is reinforced as time passes, with values exceeding 20 m/s on 15 October (Fig.2). These large values are well corroborated by the Topex/Poseidon wind speeds derived at 0841 UTC along a northeast-southwest cross-section. Wave heights of 8-9 meters are associated with the largest wind speeds. The SSM/I integrated water vapor (IWV) field is given in Fig.3 for 17 UTC 15 October 1993. At this tiime the PL has matured into a spiraliform shape, the water vapor content has a maximum value of 9-12 kg/m-2 within the main cloudy area and the values decrease to 4-6 kg/m2 surrounding the PL. TOVS retrievals for the genesis stage (not shown) indicate the presence of a PV anomaly being associated with the development of the PL.
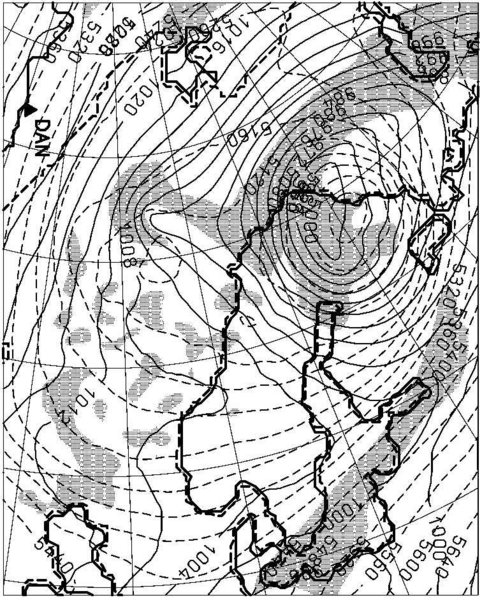
The NORLAMS imulation valid at 06 UTC 14 October (Fig.4) shows that the 500 hPa temperature is below -42 °C within a large area above and to the west of the growing surface disturbance, indicating a potentially unstable stratification in this area after 18 hours of simulation (this is the case throughout the whole simulation period (not shown)). A closer look at the IPV distribution shows that the tongue of large IPV values on the 295 K surface (pressure of about 500 hPa) after 18 hours is connected with the intrusion of cold air behind the synoptic-scale low centered (and nearly stationary) over northern Scandinavia (not shown). A region of maximum values of IPV is centered at 72.5 °N, 2 °E.
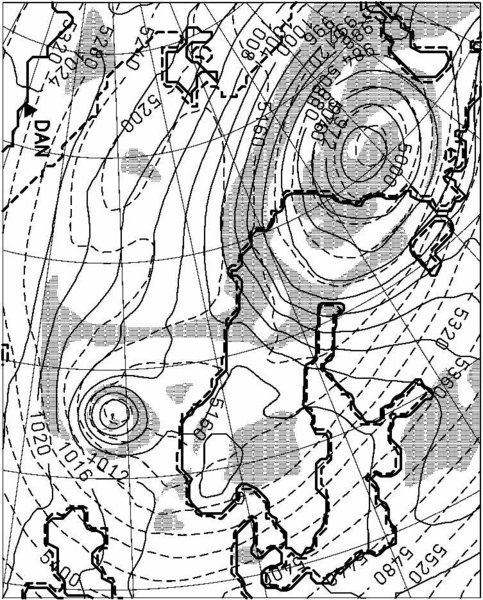
Satellite imagery is used to check the simulated position of the PL. At 12 UTC 14 October (Fig.5a), the simulated PL in the NORLAMS and NORLAMS simulations is at the right position considering that the AVHRR image is about 2 h later. The relative humidity exceeding 90% at 700 hPa is a good indicator of clouds at that level and reflects well the clouds associated with the synoptic-scale cyclone over northern Norway. At 24 h simulation time, the NORLAM humidity field reflects the 'Le Cygne' structure as seen in Fig.1. Larger differences between NORLAM and NORLAMS fields are found for 48h simulation time (Fig.5b). Both models simulate the southward movement of the PL, but NORLAM simulates the PL center more to the east and a deeper central pressure. The analysis of the MSLP at 16 October 00UTC shown by N97 yields a central pressure of 995 hPa and a position of 61°N, 2°E. Therefore, the NORLAMS simulation underestimates the eastward movement and the deepening of the PL in its mature phase. The NORLAM humidity field after 48h (Fig.5b) shows also nicely the spiral structure around the PL center.
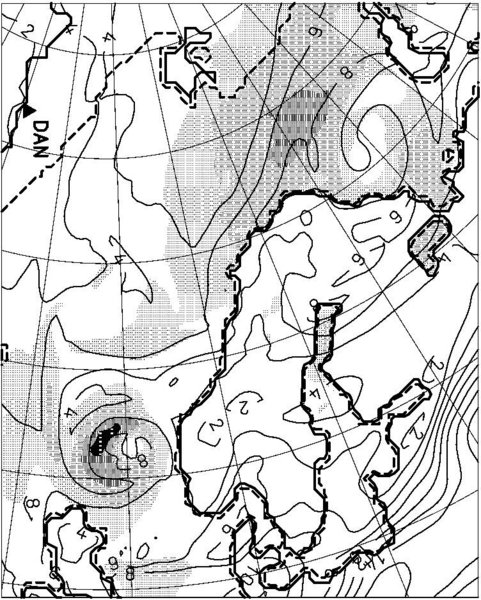
Simulated humidity and near-surface wind fields are provided on Fig.6 for 15 October 18 UTC. In the incipient stage of the polar low, simulated IWV fields (not shown) are less organized in the area where the polar low forms than SSM/I retrievals. A better agreement is found in the polar low area during the mature phase, the model reproducing clearly the region of moist air isolated from the surroundings; simulated IWV values are however smaller than observed values. As expected, the model produces a bit less structures in the near-surface wind fields than SSM/I but the classical couplet of low winds in the center of the polar low and larger wind speeds to the southwest is well observed in simulated wind speeds; however, in the incipient stage of the polar low, gradients are less steep than in satellite retrievals. Modelled wind speeds larger than 20 m/s are in good agreement with SSM/I and Topex/Poseidon retrieved values to the west of the mature low, and in the Barents Sea in connection with the synoptic-scale low.
4. Conclusions
A long-lasting polar low (three days) has been investigated using satellite observations and model simulations. In this study, observations from different sensors, namely a vertical sounder, a passive sensor and a microwave active sensor have been used. Two limited-area models (at the University of Bergen, and at MIUB in Bonn) have been run. A validation of the simulations has been performed by comparing the model outputs and the satellite retrievals. The comparisons showed that both models provided good simulations of the polar low, with the essential features of the polar low clearly reproduced in the simulations. Both models simulate the PL with a pressure anomaly of about 12-16 hPa. In spite of a better spatial resolution, humidity and surface wind speeds are generally slightly less organized in the simulations than in SSM/I retrievals. This illustrates the importance of considering in conjunction mdels and satellite observation to have a very complete description and understanding of polar lows.
The results presented here are in good agreement for the developed and mature phases of the low with those of N97 who proposed an explanation of the development based on the generalised forms of the equations for omega and geopotential tendency. However, for the early stages of development, a powerful insight into the origins and development is given by the so-called IPV thinking. In our opinion, the polar low was the result of favourable flow conditions at the surface, in the form of a shallow arctic front established south of the ice edge, together with an upper-level PV anomaly setting the stage for a positive interaction. Their subsequent interaction explains why the developing low-level wave propagates southwards, from near the ice edge zone into the Norwegian Sea. As the IPV anomaly moves south, a phase-locking between the growing surface disturbance and upper IPV anomaly occurs. Later on, the moderately strong surface sensible and latent heat fluxes (influence of the large wind speeds and the Gulf Stream), plus the horizontal convergence of humid air toward the PL contributed to the extensive vertical development.
References
Chedin, A., and Scott N.A. 1985 Initialization of the radiative transfer equation inversion problem from a pattern recognition type approach. Applications to the satellites of the TIROS-N series, Advances in Remote Sensing Retrievals, Academic press, A. Deepak Ed., 495-515.
Claud, C., Heinemann, G., Raustein E., Mcmurdie, L., 2004: Polar low 'Le Cygne': Satellite observations and numerical simulations. Quart. J. Roy. Meteorol. Soc., in review.
Grønås, S., Foss, A., and Lystad M., 1987 Numerical simulations of polar lows over the Norwegian Sea. Tellus, 39A, 334-353.
Klein, T., and Heinemann, G. 2002 Interaction of katabatic winds and mesocyclones at the eastern coast of Greenland, Meteorological Applications , 9, 407 422.
Kvamstø, N.G. 1992 Implementing the Sundqvist Scheme in the Norwegian Limited Area Model, Met. Rep. Ser., Nr. 2, Geoph. Inst. Univ. of Bergen, Norway. Available from Department of Meteorology, Geophysical Institute, University of Bergen, Norway.
Nielsen, N. W. 1997 An early Autumn polar low formation over the Norwegian Sea. J. Geophys. Res., 102, 13955 13973.