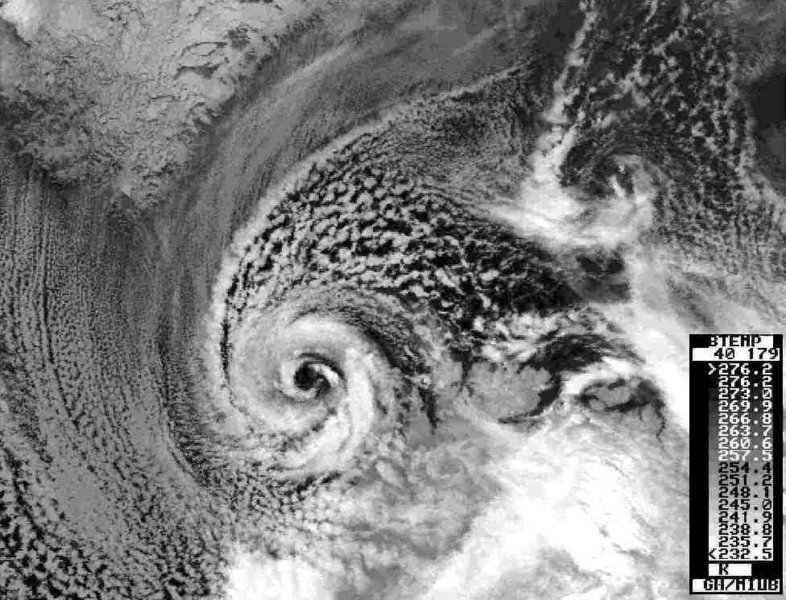
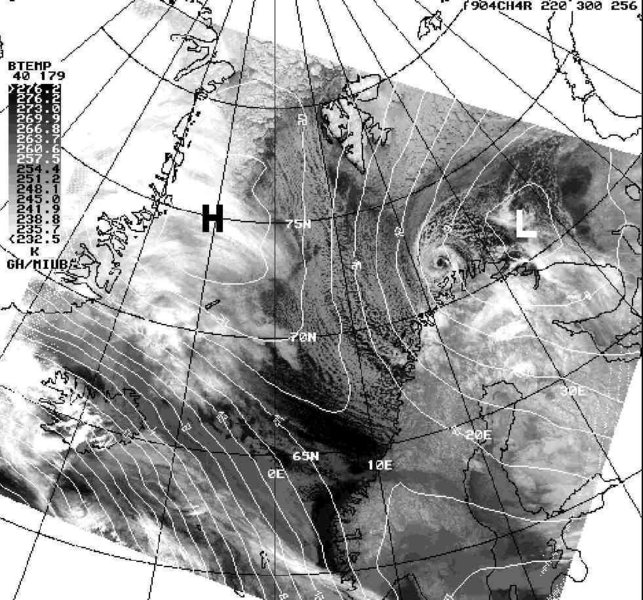
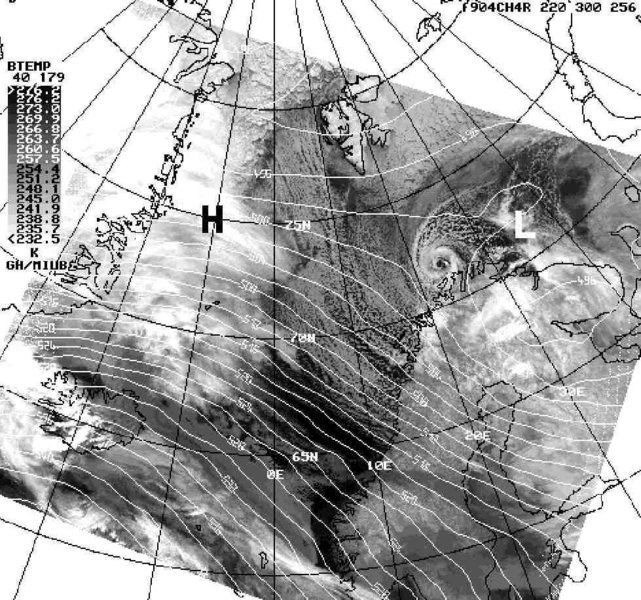
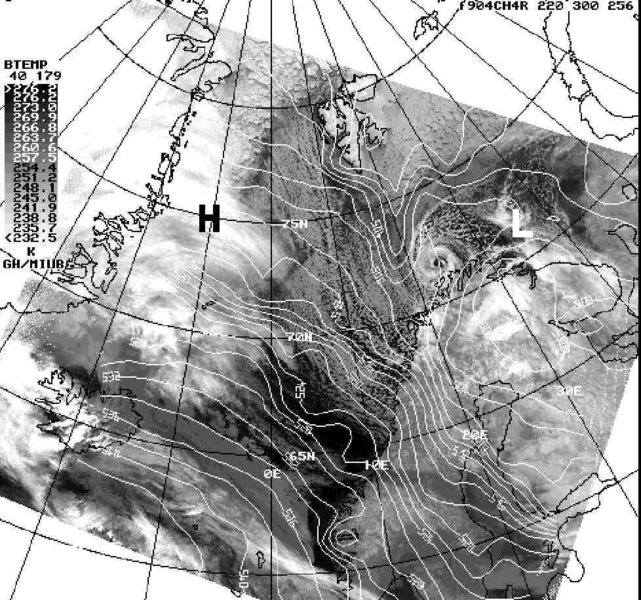
A "most beautiful" polar low over the Barents Sea February 27, 1987
On 26 February 1987 a meso-scale cyclone, resembling a tropical hurricane, developed over the western Barents Sea, reaching its mature stage at 4 UTC of 27 February 1987. Wind speeds up to 20 m/s has been recorded at Norwegian coastal stations. The centre of the mature MC can be located at 72°N/23°E close to the Norwegian coast. The MC was associated pronounced spiral arms (brightness temperatures down to -43°C) and a cloud-free centre with a diameter of 30-40 km (brightness temperatures up to +2°C). Low convective clouds on the western side (typical cloud top temperatures -20°C) are seperated from higher intensive convection cells on the eastern side (typical cloud top temperatures -30°C) by a shallow meso-scale front or convergence line indicated by a pronounced spiral arm extending from the western side of the core to the north and northeast. A detailed documentation of the synoptic development and a simulation with the numerical model of the Norwegian Meteorological Institute (DNMI) using a horizontal resolution of 25 km is given by Rasmussen (1989) and Nordeng and Rasmussen (1992). Heinemann (1995) uses TOVS retrievals as an important source of information to refine the meso-scale analysis of the vortex.
References:
Heinemann, G., 1995: TOVS retrievals obtained with the 3I-algorithm: A study of a meso-scale cyclone over the Barents Sea. Tellus 47A, 324-330.
Nordeng, T.E., Rasmussen, E.A., 1992: A most beautiful polar low. A case study of a polar low development in the Bear Island region. Tellus 44A, 81-99.
Rasmussen, E.A., 1989: A comparative study of tropical cyclones and polar lows. In: Polar and arctic lows (Eds. P.F. Twitchell, E.A. Rasmussen and K.L. Davidson), A. Deepak Publishing, 421pp.
Please click on the images for full resolution or animation.
Copyright by Günther Heinemann.