Gunnar Noer and Magnus Ovhed: Forecasting of Polar Lows in the Norwegian and the Barents Sea
Norwegian Meteorological Institute, Forecasting Division of Northern Norway
Introduction
At the weather forecasting center in Tromsoe, Northern Norway (VNN), forecasting of polar lows is done on a regular basis throughout the winter. The polar low is challenging to forecast for a number of reasons: With its small horizontal extent and short lifespan it fits poorly in the traditional text forecast with a limited amount of text, covering a coastline of up to 400 km up to 36hrs in time. The time from detection and identification till landfall is often less than the time till next major issue on national radio. The precision level in forecasting polar lows has been thought to be quite poor. In 1999 a hit rate of 5-10 % was assumed to be realistic. Few synoptic observations, no radar coverage, periods without updated satellite pictures, and notoriously unreliable model fields did nothing to improve the situation. For these reasons, the polar low was often ‘smoothed’ out in the forecast, or in many cases ignored altogether.
Because of their cyclonic nature, the polar lows tends to shift the direction of the wind against the background field north of its center. In a mountain rich area like Northern Norway this means that the weather type changes from wintry snow showers associated with westerly winds, to clear skies and a rather weak off coast flow. If the forecasts is based upon the numerical model, which in these situations usually gives west to northerly winds in the entire area, a rather embarrassing total miss in the forecast will be the result. To assess this problem, a workgroup was formed in 1999, now consisting of senior forecasters Gjertrud Royland, Trond Lien, Magnus Ovhed, Jan Erik Paulsen and Gunnar Noer. The task is threefold:
- To improve the general skills among the forecasters, and to establish a standardized methodology in diagnosing and forecasting polar lows.
- To find better formats of forecasts for polar lows.
- To collect data on the polar low situations with focus on favorable flow patterns and key parameters.
Since the polar low is a fairly rare phenomena, typically 5 -15 per season, it is important that experience is shared within the group of forecasters. The polar low has traditionally been shrouded in some mystery, so another important task of the group has been to demystify the issue by conveying hard facts based on the registrations from previous seasons. A comprehensive study of polar lows was done in the years 1982 - 85 by Lystad et. al. (1986) The work at VNN follows up on this work, but we are more focused on operational forecasting.
Facts and criteria for the Polar Low at VNN
At the forecasting division in Northern Norway, the following criteria is used to identify a developed polar low:
- Wind more than 27 kts over land or more than 33 kts over sea
- Horizontal extent 100 - 500 km
- Cyclonal in appearance
- Development in cold air outbreaks from the polar icecap, large scale winds northwesterly to northeasterly
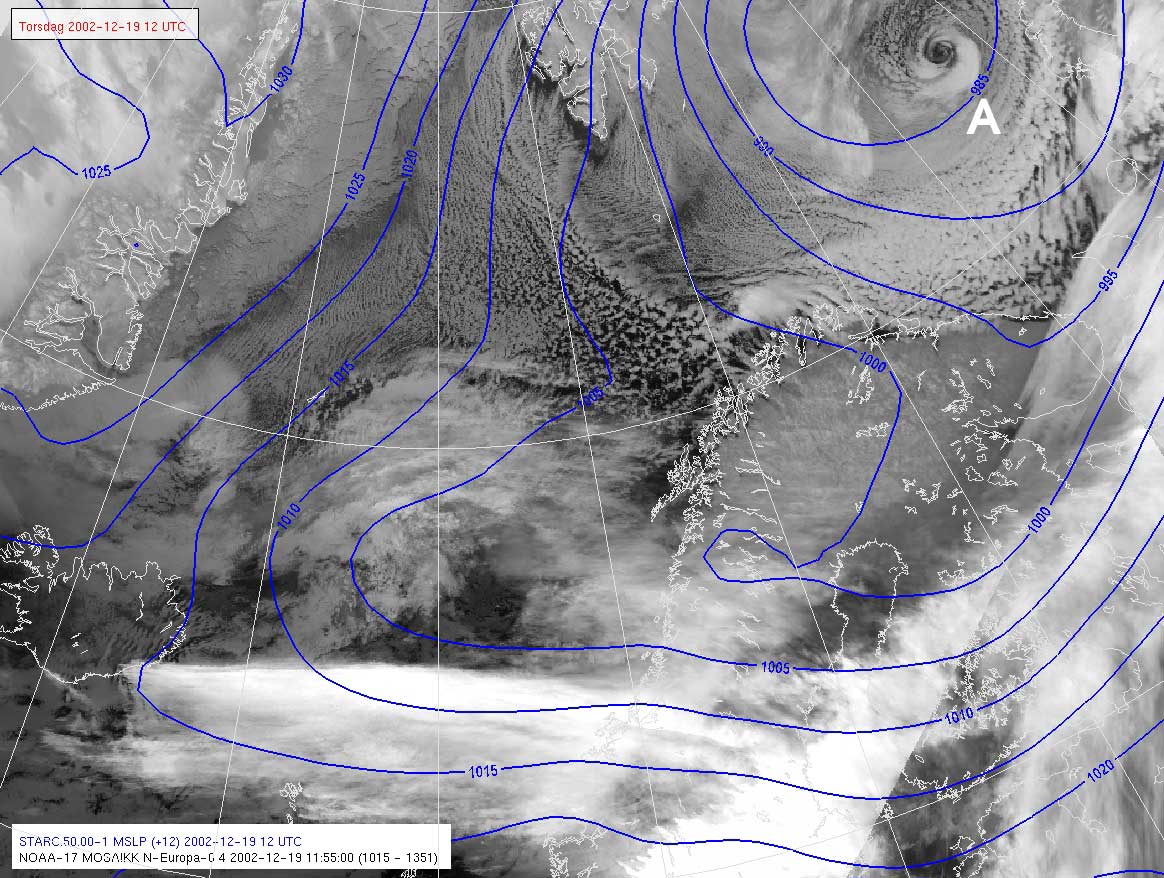
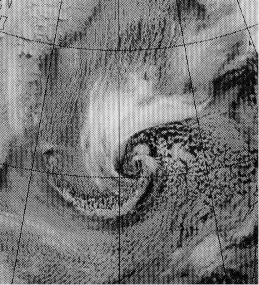
This definition could easily encompass a small synoptic low. To avoid false classification, some subjective judgment is applied: The polar low is always associated with a cold air outbreak from the polar ice, and is deeply convective in nature. In some cases, especially near the ice edge along Novaya Zemlya, old decaying lows, seen at (A) in the upper right in this picture, sometimes take on the appearance of a polar low. These are well predicted, almost stationary, and not classified as a polar low. Also, a system that has a history involving warm and cold fronts, is commonly classified as a small synoptic low(B). The common surface trough (C), is similar in the resulting weather, giving strong winds and severe snow, but has a more linear appearance. The trough is far more common, and does not need the enhancement from upper layers to develop. Vortexes with wind less than the polar low criteria is classified as shallow eddies or troughs (D).
Methodology of forecasting
At VNN, polar lows are forecasted on two levels: First an outlook for the next 24 hr is made. Then when a polar low is identified, a short term 0 - 6 hr forecast is made, in more specialized formats.
The 24 hr registration:
The 24 hr outlook is part of the daily registration, and is made throughout the winter season. On this time range, the general level of precision is limited, mainly because of the performance of the model. Thus, a possible development will only filter in into the subsequent forecasts as a general adjustment of wind and precipitation. The secondary purpose of the registration is to gather data, to heighten polar low awareness, and to introduce or try out new aspects of forecasting of polar lows.
In the registration, the following data is collected:
- The current situation, troughs or polar lows, to be compared with yesterdays outlook
- The associated situation in the upper fields, troughs, jet shear, and T500
- In the outlook for the next 24 hrs, first the current situation is classified according to surface phenomena
- 00 - 24 hrs surface condition
- 00 - 24 hrs upper fields
- Other comments on past or coming developments.
The one common factor of all the polar low cases registered at VNN is the interaction between a low level disturbance of some kind embedded in a cold air outbreak, with upper level positive vorticity advection (PVA) associated with a cold trough coming down from the Arctic basin. In some cases high values of potential vorticity (PV) in areas of jet shear has been the triggering factor. Thus the first step is to evaluate the situation in the low layers. First the current situation is assessed, with focus on areas of cold air outbreaks from the polar ice cap. All of the following phenomena have been found to be the origin of polar low development:
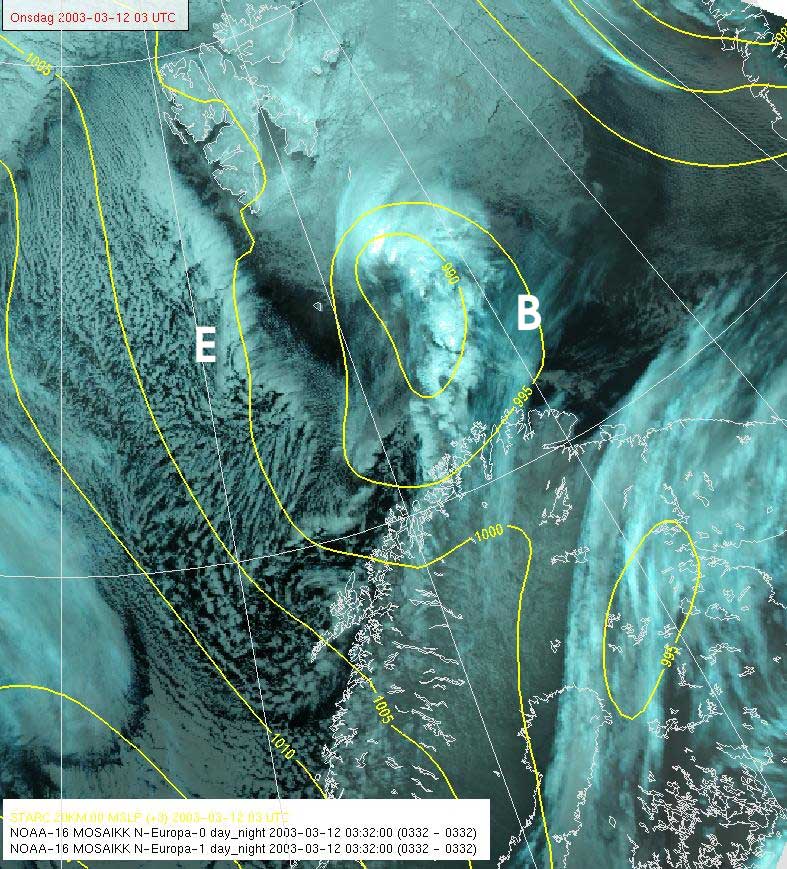
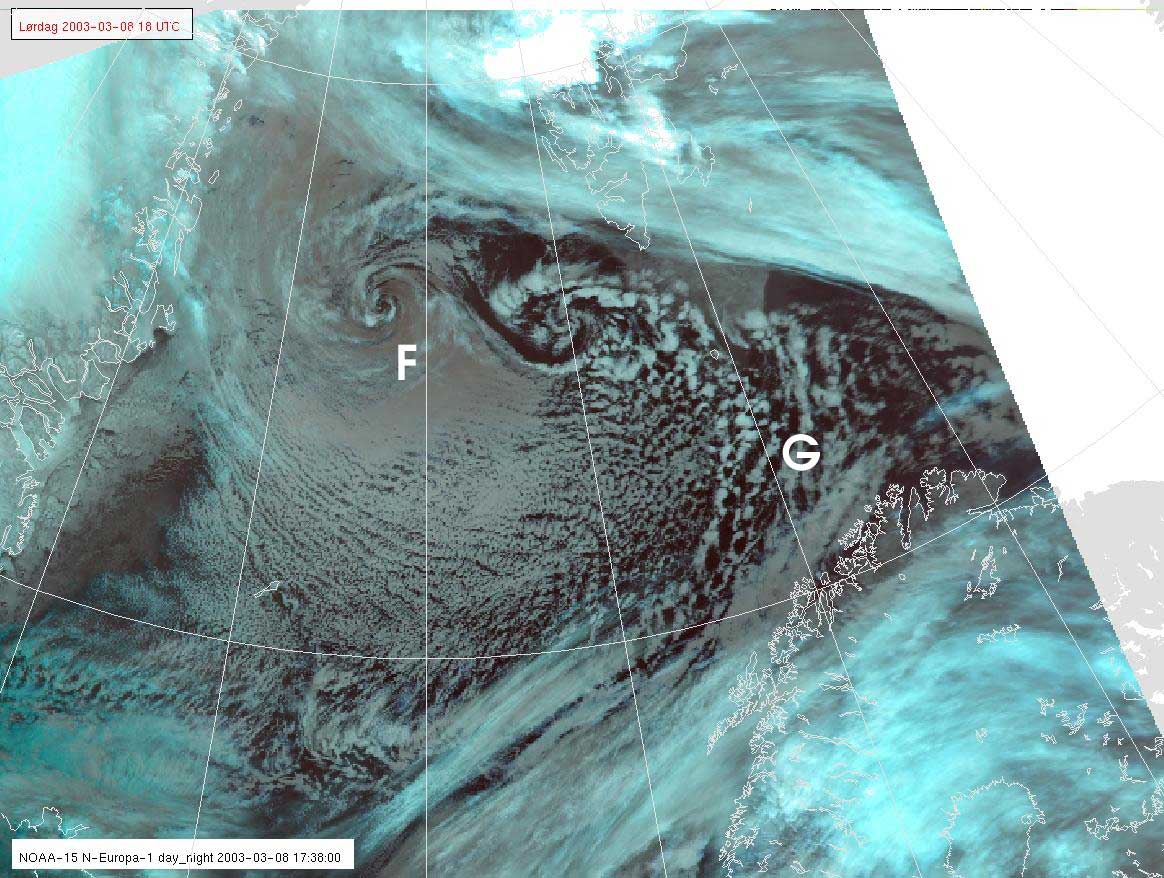
- Shallow surface fronts or convergence lines (E)
- Shallow eddies (F)
- Open convective cells (G)
- Organized troughs (C)
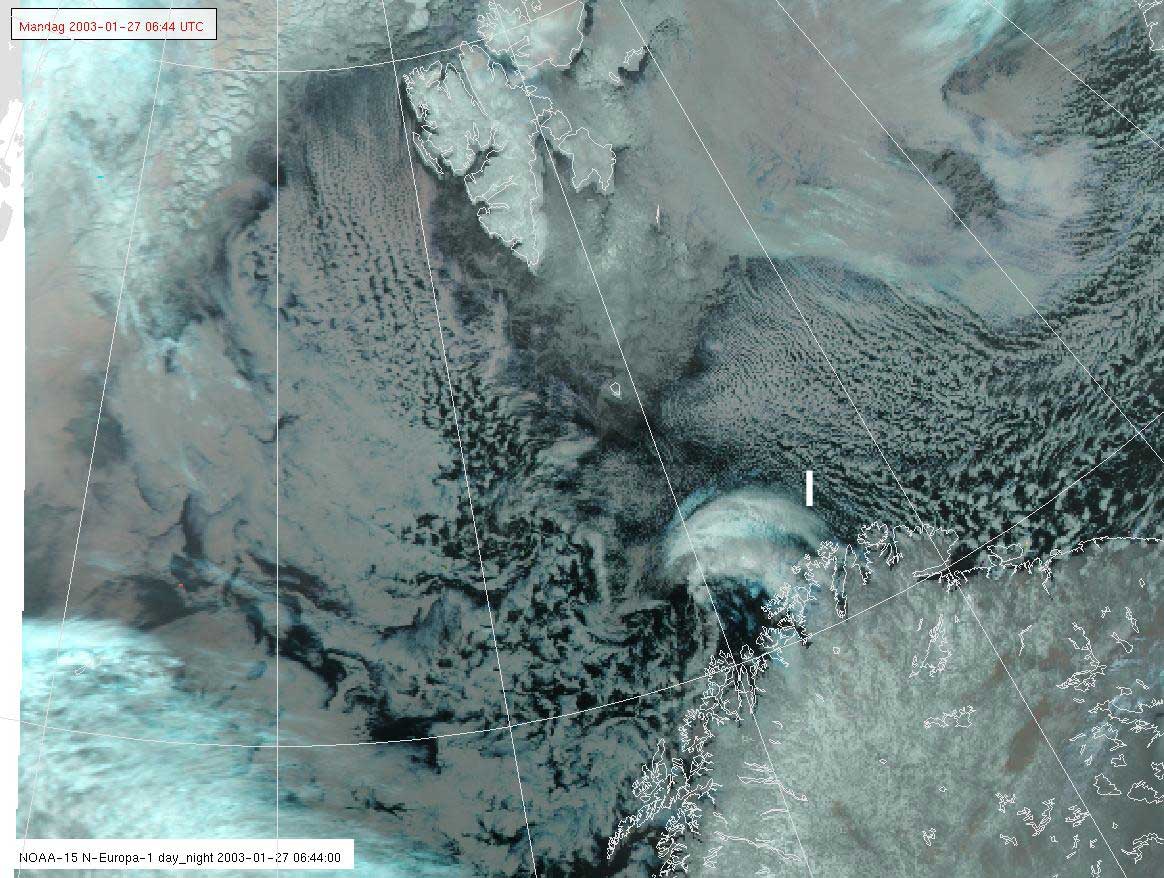
- Isolated baroclinic zones (I)
Then the development in the coming 24 hrs is considered. If the cold air outbreak persists, the low layer phenomenon is advected in this stream. If a cold air outbreak in not currently present, but will develop in the period, the risk of a polar low is small but present, since some time is needed for any low level disturbance to develop. An upper level cold core passing over a new cold outbreak where convection or other disturbances has not yet formed, will usually just result in slightly deeper convection than otherwise.
Step three is to look for a cold trough in the Z500/T500 prognostic fields. A threshold value of -39 deg C at 500 hPa is common, but a more general value is a 45 deg C difference between the sea surface temperature and T500. Thus in October and November, a threshold value of -36 deg C is used. The strength of the trough is difficult to quantify by numbers, so a subjective judgment is made where the curvature and propagation speed is considered. A fast moving and overshooting trough will usually only give a short lasted development, and leave the vortex decaying as the trough moves on. A slow moving trough with a phase lock with the low level disturbance is more likely to give full development. The intersecting point of the upper trough with the low level disturbance is the likely the site of a polar low development.
In the seasons 1999 - 2003 a polar low was found to develop in 27 % of the cases where it was anticipated. The major uncertainty in this method is the subjective judgment of the upper trough. We have yet to establish threshold values for PVA, and also the propagation speed and possible phase lock in relation to the surface disturbances have not been well enough emphasized. To do this well, the propagation speed and direction of the low level disturbances must be known, and this is an area of uncertainty itself.
The precision level of the upper fields in the model is another uncertainty. There could quite probably be deviations as the air mass is coming out of areas with minimal input of data from synoptics and soundings. The main tool to evaluate this would be to compare areas of stratospheric dry air intrusion from water vapour satellite images with prognostic potential vorticity fields. Since the Meteosat does not cover areas this far north, this has not been done at VNN so far.
Short term forecasting
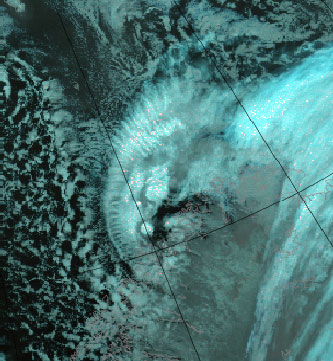
If a polar low is identified from AVHRR-images, short term forecasting is initiated, preferably 6 hrs before the low is reaching the coastal fishing areas. Now the movement and strength of the system must be considered in detail. Because of the lack of observations and soundings in the area, any assessment is based almost uniquely on model fields. So far this has been the old 50km resolution Hirlam model, but the 20 km version has recently been adopted. The 50 km was not able to resolve the individual polar low, but could give a reasonable picture of the large scale flow in witch the polar low was embedded. In relation to this, the track of the low has in most of the cases been along the winds at 700 hPa, but the movement is also influenced by the lower layers. A useful rule in this context is that cold air advection always gives backing wind with height, in accordance with the thermal wind equation. Thus the polar low will be deflected slightly to the right relative to the 700hPa wind, looking downstream. The wind induced by the polar low is acting against the large scale wind field on the north and east side, giving calm winds and dry and clear weather near the Norwegian coast. On the southern side, the wind and precipitation is strengthened. This means that adverse weather need only be forecasted to the south of the anticipated line of movement of the center.
To assess the wind speed, the best tool is synoptic observations, but because of the scarcity in these areas, this is a rare luxury. The situation has improved somewhat with the introduction of satellite derived winds, but the 2 hr time delay means that they are less useful in such a highly dynamic situation. Often the forecaster must rely on a subjective judgment based on the visual impression. Of visual clues, the following can be mentioned:
- A clear eye is a promising sign
- A Polar Low with a smooth and outdrawn appearance is often stronger than when individual CB's can be seen in the spiral.
- A wavelike pattern of cirrus outflow radiating out along the rim of the low is a sign of strong winds (K)
- Higher cloud top temperatures in the spiral end leading in to the center indicating sinking motion can be an indication of strong winds around the center (L).
- Singular lows are usually stronger than when there are two or more centers.
- Cloud top temperature is less useful, since equally low temperatures can be found in ordinary troughs or even mature isolated CB's. Cloud top temperatures warmer than -35 deg C indicates that the vortex is just another shallow system not yet developed into a polar low.
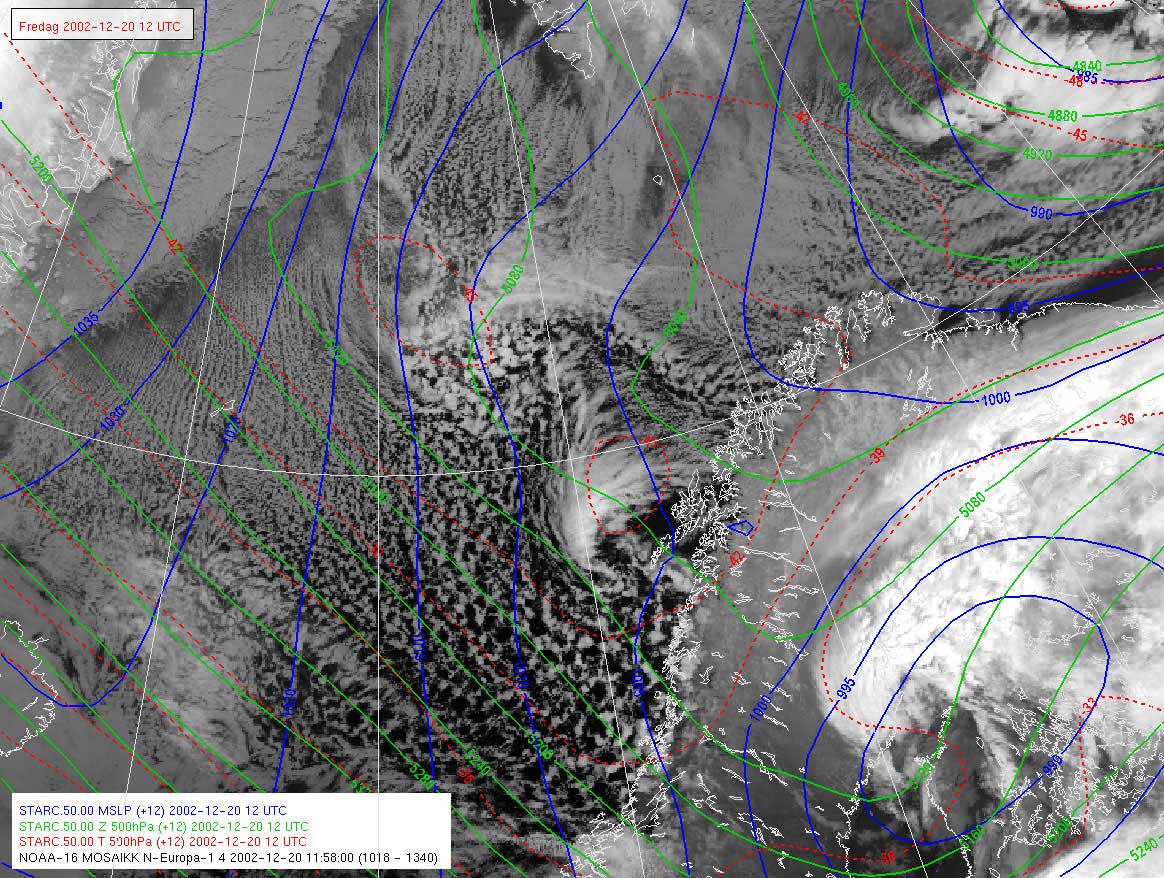
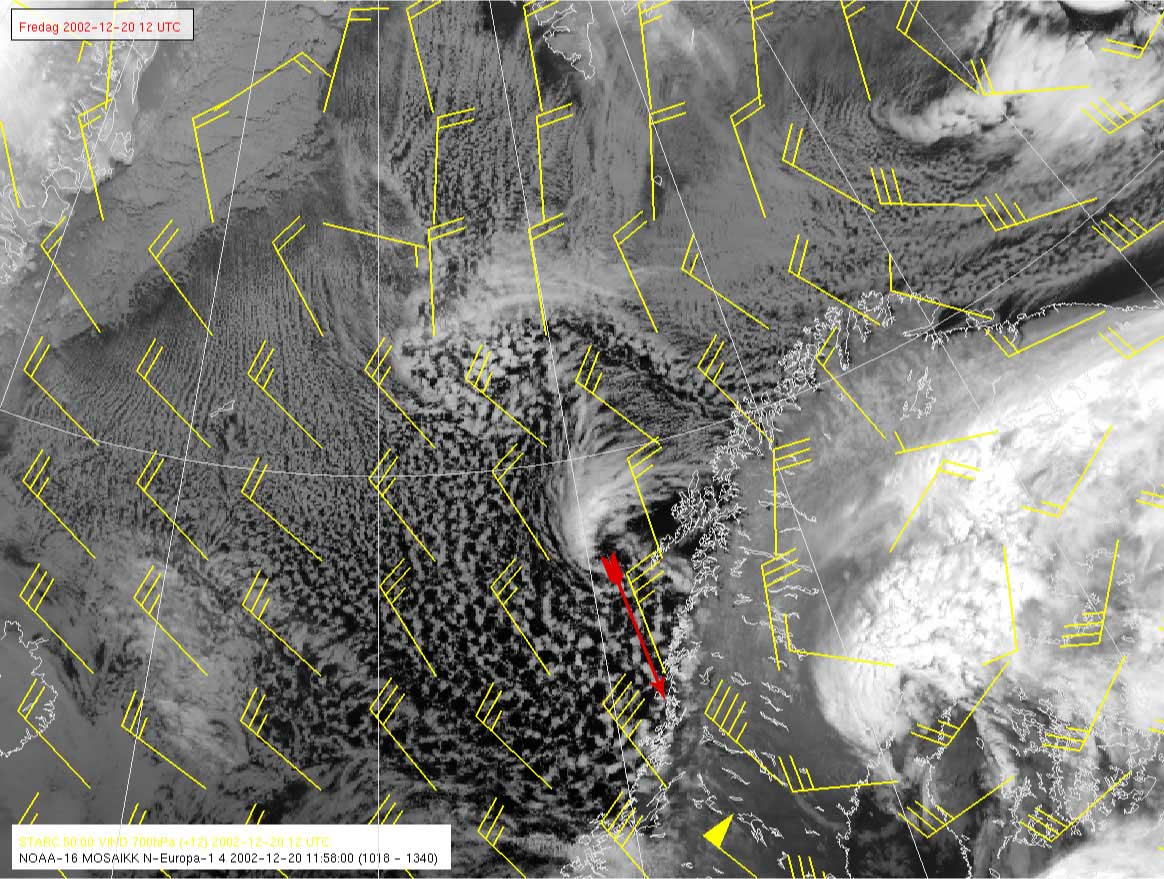
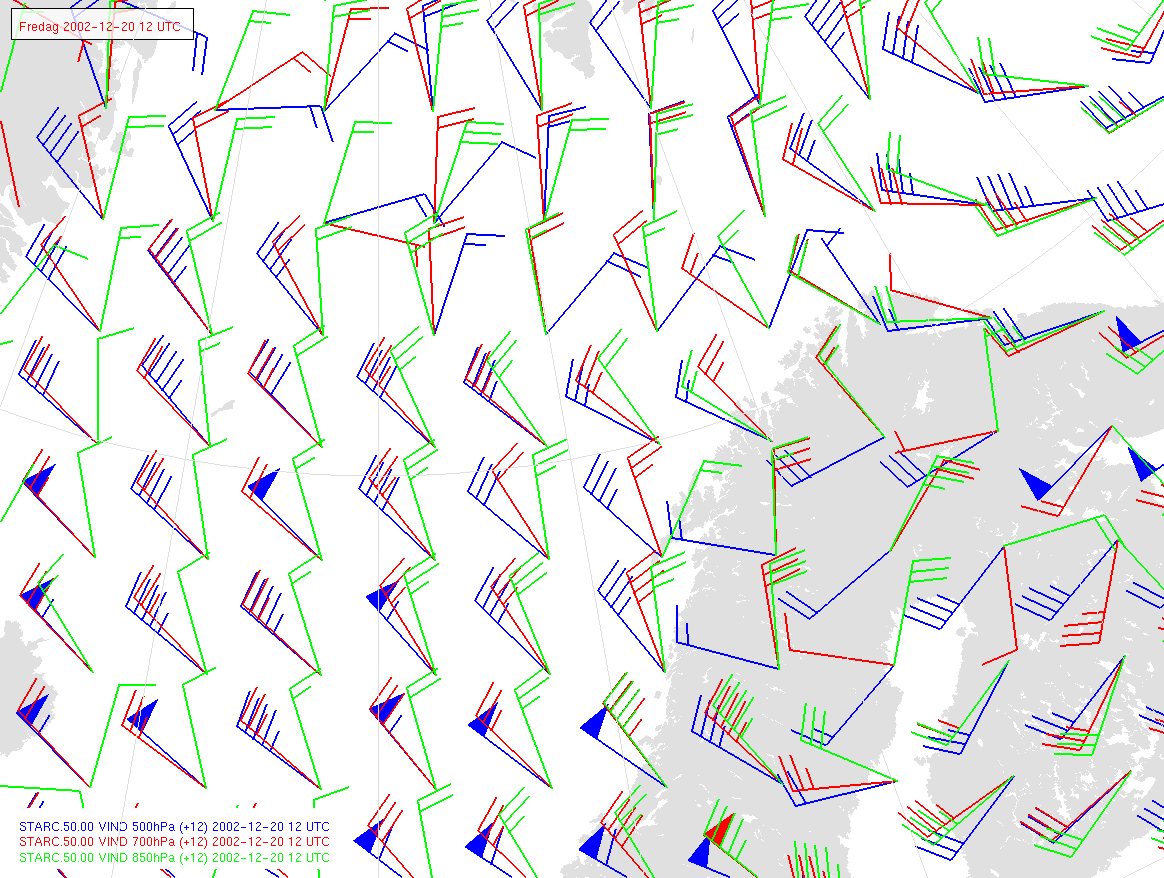
A case from December 20th 2002 illustrates the procedure: At 12Z, the low can be seen outside the Lofoten area. Blue lines are MSLP, green lines are Z500. Red lines give T500. This low is spun up under influence of the left jet shear zone and enhanced instability from a passing cold core. A line along the 700 hPa gives the 'worst case', or the left edge of the area with strong winds. The low is advected downstream under the influence of the wind in the 850 to 700 hPa, hitting the coast of Nordland some 6 hrs later. The propagation speed is usually 1/3 to 1/2 of the wind at steering level, in this case 18kt. Synoptics confirm the rather weak winds and cloudfree area to the north of center.
Aside from the visual impression, a mature polar low will strengthen the wind on the right and rear side by 2 to 4 Beaufort. When this is combined with the background field, a rough estimate of wind speed can be found. The Hirlam 20km that just recently replaced the old 50km version has been very promising, and have in several cases given realistic winds. The adjustment of wind will therefore probably be less with the Hirlam 20 as source for the background fields.
Polar Low forecasts
Because the polar low usually develops rapidly in a for the forecaster quite busy situation, a specialized forecast must be simple and labor effective, and it must be issued independent of any fixed release schedule. Therefore the traditional text forecasts for land and sea have a limited value in this context. So far, the best format is the ordinary gale-warning, but since this is only issued to naval users, there is a need for better formats to reach the common land-base public. For aviation, the ordinary SIGMET and ICEMESSAGE warnings are the main formats, but since these are limited to one pr. FIR (Flight Information Region) at any given time, they are often tied up in forecasting weather in a wider area. Therefore a new type of graphic forecast has been introduced. The Special Weather Information (SWI) chart is basically a simplified significant weather chart, where all other information than that related to the polar low is stripped away. It is an analysis of the current situation, giving position, propagation speed, wind speed, and other significant information, and also an estimate of the level of confidence in the estimates. Information on further development is added if the confidence is felt to be sufficient. The SWI-chart is issued every 6 hrs when the low is over open ocean, and every 3 hrs when it is near to the coast. As the SWI-chart is a relatively new feature and still in development, the receivers are so far limited to the other main forecasting centres in Oslo and Bergen, the airport met services in Bodoe, Bardufoss, Andoeya and Longyearbyen, the main rescue central in Bodoe and the 330 sq. at Banak operating the Air Force's Sea King rescue helicopters.
Registration results
The registration has so far confirmed the monthly variation that was found in the 1982-85 study, with maximum frequency in January and March, and a secondary maximum and seasonal start in October. The minimum in February is probably due to high occurence of continental high pressure over central Scandinavia, giving a southerly flow along the Norwegian cost. We have only 41 cases in the four seasons 1999 - 2003, whereas the old study found 79 cases in the three years of 82 - 85 (Lystad et. al, 1986). The difference in frequency can be explained by better satellite coverage and more restrictive criteria. Many of the cases that we classify as common troughs would have been classified as polar lows in the old days. There is also a quite large annual variation. In the months of February to may 2003 the low number can be explained by long spells of southerly winds.
Figure: The monthly frequency of polar lows in the years 1999 - 2003
We have seen that polar lows can develop from a multitude of different surface conditions, always in association with a cold air outbreak, and in every single case under the influence of a cold trough aloft. Hence we have abandoned the old classification (Lystad et. al, 1986) where the polar low was divided into classes according to driving factor: a) cold air outbreaks, b) warm cores in a middle layer, c) upper cold troughs or d) baroclinic zones. Also we do not differ between the comma cloud and the polar low, as these give the same kind of weather, and have to be treated in the same manner in forecasting.
Further empirical results:
- Propagation speed is usually 15 – 25kts. This is usually 1/3 to 1/2 of the wind speed in the background 700 hPa field and with a similar direction. Propagation speed of 32kts has been recorded.
- Cloud top temperatures is usually less than -40 ºC, the tops frequently reaching well above the 500 hPa level.
- The temperature difference between sea surface and T500 is usually around 45ºC.
- Lifespan 12 – 24hrs, rapidly dissipating after landfall
- Highest occurence south of 75 degrees north and east of Jan Mayen, in the border areas of the Golf current, where the sea surface temperature gradient (M) is at its highest.
From accounts from personnel on fishing vessels the wind increase from breeze to gale force winds typically happen in 15 minutes. It is accompanied by heavy snowfall and rough seas, and in some cases severe icing.
The future of polar low forecasting at VNN
There is still room for improvement in the forecasting skills, but it is far from obvious where the greatest potential is. The quality of the forecast depends roughly on three parts: the forecasters skill and methodology, observations and model performance.
The understanding of the dynamical processes involved among the forecasters can be improved. In about three out of four cases, polar lows does not develop despite the conditions been favorable according to our current methodology. There several reasons for this. The methodology is still somewhat crude and the general understanding of the method must increase. The interpretation of different mesoscale features in the satellite images may differ among the forecasters. Feedback after each situation is one key factor to build up experience and skill among the forecasters.
The introduction of satellite derived winds means we now have a very useful tool to gather surface data, but aside from this we do not expect any great improvement in the availability of satellite data from the arctic regions in the near future. The Norwegian net of weather radars is slowly extending north and will in 5-10 years time cover the coast of Northern Norway. Since the polar lows in most cases are limited vertically to 5-8km, the useful range of radars in this context is less than 250km. Thus weather radars will not dramatically improve our forecasting abilities, but they will be a rich source to knowledge of polar lows and winter weather in general in the coastal regions. WV imagery from MODIS is currently not available to Norwegian forecasters, but this would be a most effective tool for tracking cold cores coming down from the arctic basin.
The resolution and quality of the available model data will of course improve. In addition to the 20km model, a 10km model is introduced this winter. However model performance will still be limited by the low density of observations with high vertical resolution in lower levels. Therefore, although models now start to resolve mesoscale features, we still expect substantial errors in the the presenting of individual polar lows.
The conclusion is that the improvement of the forecasting method and a good training and feedback program for the forecasters has the fastest, cheapest and probably also the greatest impact on the forecasting quality the nearest 5-10 years. Specialized polar low forecasts is only at a starting point and we will work to increase product quality and distribution network.
References:
Lystad, M. Main editor. 1986: The Polar Low project 1982 - 1985. The Norwegian Meteorological Institute.