Empirical Studies
Mathematical Formulas in Real-World Java Projects

We use the term formula code to refer to fragments of source code that implement a mathematical formula. In our empirical studies we analyze the diversity and frequency of formula code in open-source-software projects. In an exploratory study, we investigated what kinds of formulas are implemented in real-world Java projects and derived syntactical patterns and constraints. We refined these patterns for sum and product formulas to automatically detect formula code in software archives and to reconstruct the implemented formula in mathematical notation. In a quantitative study of a large sample of engineered Java projects on GitHub we analyzed the frequency of formula code and estimated that one of 700 lines of code in this sample implements a sum or product formula. For a sample of scientific-computing projects, we found that one of 100 lines of code implements a sum or product formula. To assess the need for tool support, we investigated the helpfulness of comments for program understanding in a sample of formula-code fragments and performed an online survey. Our findings provide first insights into the characteristics of formula code, that can motivate further studies on the role of formula code in software projects and the design of formula-related tools.
Stack Overflow Code Snippets in GitHub Projects

Stack Overflow is the largest Q&A website for developers, providing a huge amount of copyable code snippets. Using these snippets raises various maintenance and legal issues. The Stack Overflow license requires attribution, i.e., referencing the original question or answer, and requires derived work to adopt the license. While there is a heated debate on Stack Overflow's license model for code snippets and the required attribution, little is known about the extent to which snippets are copied from Stack Overflow without proper attribution. In this paper, we present the results of an empirical study which analyzes attributed usages of Stack Overflow code snippets in GitHub projects for the most common programming languages, and estimates a lower bound for unattributed usages in Java files. On average, one out of 32 repositories contained a reference to Stack Overflow. Further, we found that developers rather refer to the whole thread on Stack Overflow than to a specific answer. For Java, at least two thirds of the copied snippets are not attributed.
How Developers Locate Performance Bugs (ESEM 2015)
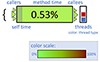
Background: Performance bugs can lead to severe issues regarding computation efficiency, power consumption, and user experience. Locating these bugs is a difficult task because developers have to judge for every costly operation whether runtime is consumed necessarily or unnecessarily. Objective: We wanted to investigate how developers, when locating performance bugs, navigate through the code, understand the program, and communicate the detected issues. Method: We performed a qualitative user study observing twelve developers trying to fix documented performance bugs in two open source projects. The developers worked with a profiling and analysis tool that visually depicts runtime information in a list representation and embedded into the source code view. Results: We identified typical navigation strategies developers used for pinpointing the bug, for instance, following method calls based on runtime consumption. The integration of visualization and code helped developers to understand the bug. Sketches visualizing data structures and algorithms turned out to be valuable for externalizing and communicating the comprehension process for complex bugs. Conclusion: Fixing a performance bug is a code comprehension and navigation problem. Flexible navigation features based on executed methods and a close integration of source code and performance information support the process.
Sketches and Diagrams in Practice (FSE 2014)
Sketches and diagrams play an important role in the daily work of software developers. In this paper, we investigate the use of sketches and diagrams in software engineering practice. To this end, we used both quantitative and qual- itative methods. We present the results of an exploratory study in three companies and an online survey with 394 participants. Our participants included software develop- ers, software architects, project managers, consultants, as well as researchers. They worked in different countries and on projects from a wide range of application areas. Most questions in the survey were related to the last sketch or dia- gram that the participants had created. Contrary to our ex- pectations and previous work, the majority of sketches and diagrams contained at least some UML elements. However, most of them were informal. The most common purposes for creating sketches and diagrams were designing, explain- ing, and understanding, but analyzing requirements was also named often. More than half of the sketches and diagrams were created on analog media like paper or whiteboards and have been revised after creation. Most of them were used for more than a week and were archived. We found that the majority of participants related their sketches to methods, classes, or packages, but not to source code artifacts with a lower level of abstraction.
How Humans merge UML-Models (ESEM 2012)
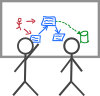
So far, research on model merging has mostly focused on algorithmic problems. But, there are various situations when software engineers have to compare and merge different models manually or at least make important decisions. In this paper, we provide insights into the process of how users compare and merge visual models. To this end, we observed people’s activities when manually merging UML class diagrams and analyzed the recorded data following the Grounded Theory approach. To illustrate the usefulness of our results we derived some guidelines for tool design.
The Order of Things - How Developers Sort Fields and Methods (ICSM 2012)
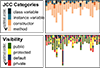
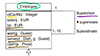
In source code files, fields and methods are arranged in linear order. Modern programming languages such as Java do not constrain this order—developers are free to choose any sequence. In this paper we examine the largely unexplored strategies developers apply for ordering fields and methods: First, we use visualization to explore different ordering criteria within two open source Java projects. Second, we verify our observations in a metric-based analysis on an extended set of 16 projects. Third, we present the results of a survey that reflects the opinion and applied ordering strategies of 52 developers. 87% of the participants agreed that ordering of fields and methods is meaningful or important. Our results suggest that there exists a set of criteria repeatedly used for ordering. Among these, the categories defined in the official Java Code Conventions appear to be the primary ordering criterion. However, in the individual strategies of the participants of the survey, we identified 15 ordering criteria additional to the five criteria we considered in the empirical analysis.
Uncovering Strengths and Weaknesses of Radial Visualizations - An Empirical Approach (InfoVis 2010)
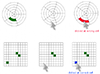
Radial visualizations play an important role in the information visualization community. But the decision to choose a radial coordinate system is rather based on intuition than on scientific foundations. The empirical approach presented in this paper aims at uncovering strengths and weaknesses of radial visualizations by comparing them to equivalent ones in Cartesian coordinate systems. We identified memorizing positions of visual elements as a generic task when working with visualizations. A first study with 674 participants provides a broad data spectrum for exploring differences between the two visualization types. A second, complementing study with fewer participants focuses on further questions raised by the first study. Our findings document that Cartesian visualizations tend to outperform their radial counterparts especially with respect to answer times. Nonetheless, radial visualization seem to be more appropriate for focusing on a particular data dimension.
Copyright Notice
The documents distributed by this server have been provided by the contributing authors by means to ensure timely dissemination of scholarly and technical work on a noncommercial basis. Copyright and all rights therein are maintained by the authors or by other copyright holders, notwithstanding that they have offered their works here electronically. It is understood that all persons copying this information will adhere to the terms and constraints invoked by each author’s copyright. These works may not be reposted without the explicit permission of the copyright holder.