2. Reports of current polar low research
2.10 Interaction of katabatic winds and mesocyclones at the eastern coast of Greenland
Thomas Klein, Swedish Meteorological and Hydrological Institute, S-60176 Norrköping, Sweden
Günther Heinemann, Meteorologisches Institut Universität Bonn, Auf dem Hügel 20, D-53121 Bonn, Germany
Abstract
Satellite images occasionally show the existence of mesocyclones (MCs) close to the eastern coast of Greenland, especially in the region of Angmagssalik/Tasiilaq. The forcing mechanisms of such MCs are investigated by means of numerical simulations with a three-dimensional mesoscale model. The special characteristics of the East Greenland topography are shown to be a key factor for the development of the MCs. The channeling of the flow in large valleys along the East Greenland coast leads to a convergence, implying a vertical stretching and the generation of cyclonic vorticity. This convergence can be strong during intense katabatic storms, so-called Piteraqs, which are a much-feared phenomenon in that area of Greenland. The results of the simulations suggest a close relationship between the occurrence of Piteraqs and the generation of mesoscale vortices close to the East Greenland coast.
Introduction
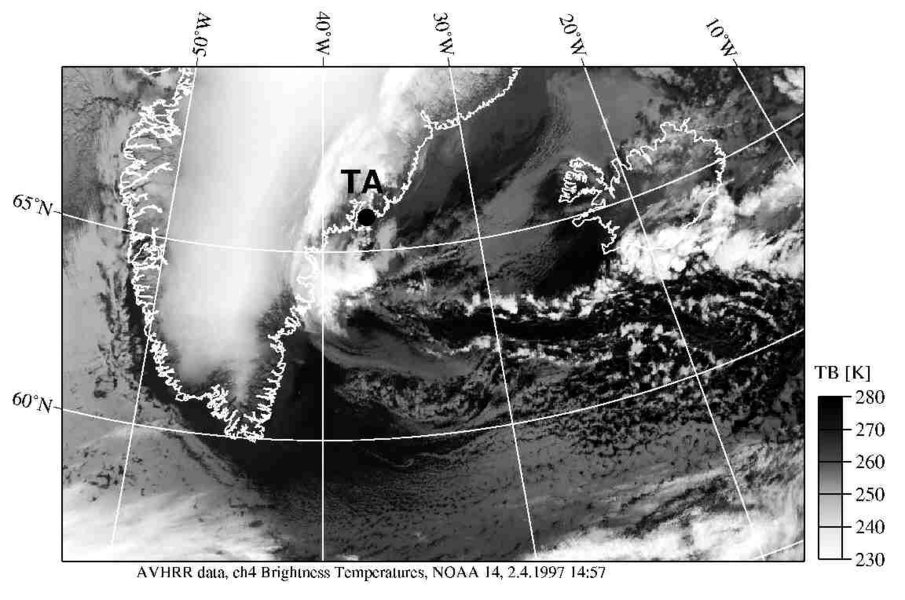
The topography of the East Greenland coast near Angmagssalik (Tasiilaq, see Fig.1) seems to be important for the development of MCs. Satellite observations occasionally show the existence of mesoscale vortices close to the coast near Angmagssalik. AMC can be observed south of Angmagssalik close to the Greenland coast in Fig.1. During certain synoptic situations (i.e. a synoptic low located between the east coast of Greenland and Iceland), the katabatic flow at the Greenland coast can be significantly supported by a synoptic pressure gradient, leading to hazardous katabatic storms called 'Piteraq' by the Inuits. These storms with extraordinary wind speeds of hurricane force are a much-feared phenomenon, and the correct prediction of such Piteraqs is one essential task for the operational forecast for that region. Rasmussen (1989) describes a disastrous Piteraq occurring in 1970, during which wind gusts of 80 ms-1 were estimated and which caused significant damage in the Angmagssalik area. In the present study, the interaction of katabatic storms and MCs at the eastern coast of Greenland near Angmagssalik is investigated by simulations with the mesoscale model NORLAM.
The model
The limited area primitive equation model NORLAM used for the simulations of MCs and katabatic storms at the eastern coast of Greenland is the former operational model of the Norwegian Meteorological Institute (DNMI) at Oslo. NORLAM has been successfully applied for the simulation of MCs, katabatic winds and other mesoscale phenomena in the Arctic and Antarctic (e.g. Skeie & Grønås, 2000; Klein & Heinemann, 2001; Klein et al., 2001). For the present simulations, resolutions of 50 km and 25 km are used in a nested mode. Global analyses of the European Centre for Medium-range Weather Forecasts (ECMWF) are used as initial and boundary fields for the NORLAM runs with a grid spacing of 50 km (LAM50). Runs with 25 km grid spacing (LAM25) are then performed with the results of the LAM50 run as boundary conditions, using either the 0 h initialized LAM50 analysis or the 6 h LAM50 forecast as initial state. The model is used with a domain size of 121 x 97 grid points for the LAM50 and LAM25 simulations. The model domains are 6000kmx5000km (LAM50) and 2500kmx3000km (LAM25). 30 -levels are used for the vertical discretization with about half the levels located below 850 hPa in order to resolve the boundary layer well.
Simulation of the MC event 1-2 April 1997
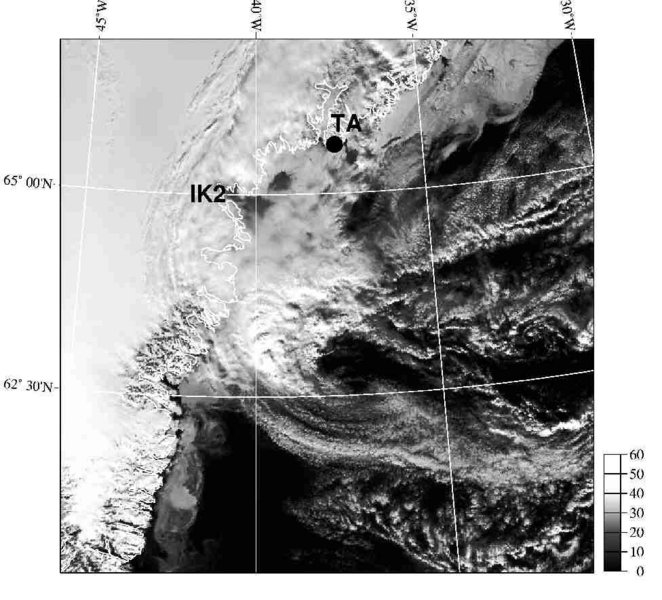
The East Greenland MC event discussed in this section took place during 1 to 2 April 1997. On satellite images for 1457 UTC 2 April 1997 (Figures 1a and 1b) a MC can be observed south of Angmagssalik close to the Greenland coast (centre at about 63°N/37°W). For this case data of the NSCAT (NASA Scatterometer) are available with 50 km resolution. NSCAT-derived 10 m wind vectors (obtained from the Center for Ocean-Atmospheric Prediction Studies, COAPS) for the afternoon of 2 April are shown in Fig.2. The use of scatterometer data is restricted to the ice-free ocean, but a clear signal of the MC (marked 'M2') with wind speeds of 15-20 ms-1 can be seen in the NSCAT wind field. Although NSCAT has a better capability to detect MCs compared to the ERS scatterometer (see Lieder & Heinemann 1999), MCs of a typical size of 200-300 km are still difficult to detect because of the coarse scatterometer resolution and data gaps.
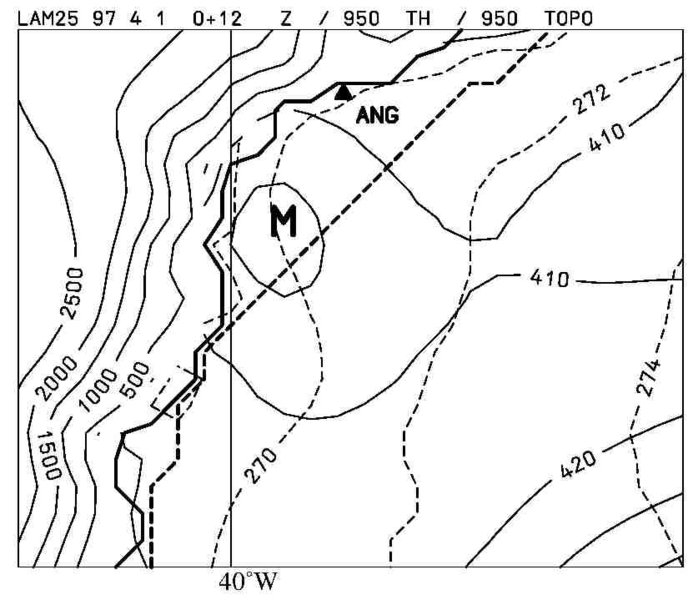
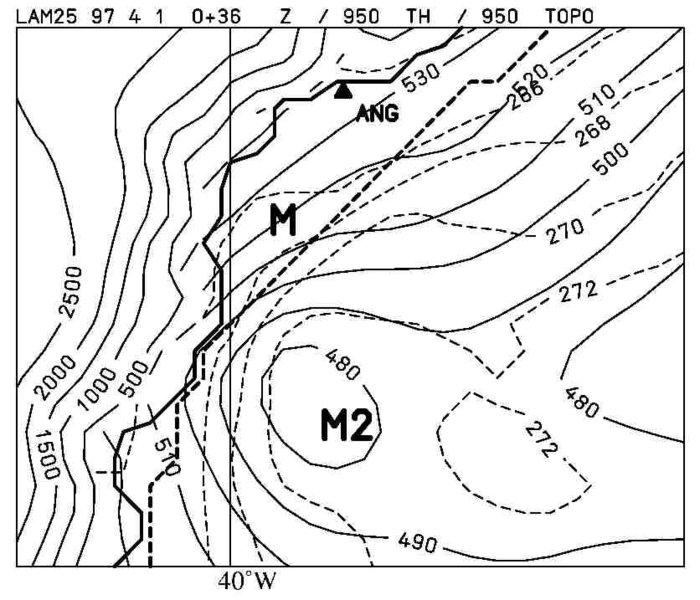
NORLAM simulation for that case started at 0000 UTC 1 April (Fig.3) yield the development of a MC (named 'M' hereafter) already at 1200 UTC 1 April, i.e. about 24 h prior to the time of the MC signal in the satellite images. This MC is not associated with a cloud structure and develops close to the East Greenland coast. The MC has a horizontal scale of about 250-300 km and is associated with a closed low-level circulation. The wind speeds at the lowest NORLAM -level have values of up to 23 ms-1 over the Greenland ice sheet (Fig.4). The strong convergence of the winds at the lower part of the slope (especially in the valley region of Ikeq) is associated with an anomaly of the potential vorticity (PV), which is indicated in Fig.4, where values larger than 1.5 PVU (potential vorticity unit, 1 PVU=10-6m2s-1 kg-1K) at 925 hPa are shaded for 0600 and 1200 UTC.
According to the simulation results, this first system M weakens during the following 6 h and seems to dissipate, although a mesoscale trough remains close to the coast. In that area of cyclonic flow, a re-intensification or new development occurs in the morning of 2 April. The location of this second MC (named 'M2' hereafter) simulated by NORLAM is in very good agreement with the position of the MC observed on the satellite images (Fig.5).
Conclusions
The cold airflow from the Greenland ice sheet and/or the preexistence of M are important prerequisites for the development of M2. The MC case of 1-2 April 1997 is therefore an interesting example of how the Greenland ice sheet topography and the associated katabatic near surface flows in the Angmagssalik region can contribute to the genesis of MCs in that area.
References
Klein, T., Heinemann, G., 2001: On the forcing mechanisms of mesocyclones in the eastern Weddell Sea region, Antarctica: Process studies using a mesoscale numerical model. Meteorologische Zeitung N.F. 10, 113-122.
Klein, T., Heinemann, G., Bromwich, D.H., Cassano, J.J., and K.M. Hines, 2001: Mesoscale Modeling of Katabatic Winds Over Greenland and Comparisons with AWS and Aircraft Data. In print by Meteor. Atmosph. Phys.
Lieder, M., Heinemann, G., 1999: A summertime Antarctic mesocyclone event over the Southern Pacific during FROST SOP3: A meso-scale analysis using AVHRR, SSM/I, ERS and numerical model data. Weather and Forecasting, 14, 893-908.
Rasmussen, L., 1989: Den dag, Angmagssalik naesten blaeste i havet. Vejret, 2, Danish Meteorological Society, 3-14.
Skeie, P., Grønås, S., 2000: Strongly stratified easterly flows across Spitsbergen. Tellus 52A, 473-486
Please click on the images for full resolution or animation.