2. Reports of current polar low research
2.7 Satellite climatologic and typization of antarctic mesoscale vortices in comparison with Arctic
E.I. Loutsenko, Meteorology Department, Arctic and Antarctic Research Institute, 38, Bering street, Saint-Petersburg, 199397, Russia
In the recent years the processesus of the mesoscale cyclogenesis in the South Ocean atmosphere was analyzed above the Ross Sea, (Carrasco and Bromwich, 1994; Carrasco and Bromwich, 1996), Weddell Sea (Heinemann, 1995), Amundsen Sea, Bellingshausen Sea (Carrasco and Bromwich, 1993; Lieder and Heinemann, 1999), as well as in the Australasian sector (Carleton and Song, 1997). This research was based on the initial materials such as satellite observations' data for the period from a few months up to a year, except the carrying out of the investigation for the Weddell Sea, when were used the materials collected during two winter and eight summer seasons. The South Ocean sector 0-90° E remained out the investigation field. Daily satellite data for the region 0-90° E on the cloudiness obtained from the Antarctic Molodezhnaya station for the period 1984-1995 were used as an original information for the proposed research. The main part of the used materials is presented by the cloudy imagery in the IR-diapason and, only during the summer period, in a partially visible specter section. As the result of the treatment of this information was created the catalogue of the cloudy mesoscale vortices (about1550 cases), which includes geographical coordinates of their centers, horizontal sizes and forms. In this case were taken into account only isolated and unrelated with the Polar Front cloudiness mesoscale vortices. Horizontal sizes of these formations did not exceed 1000 km and a major part were formed by the intrusion of cold Antarctic air in the back of the depression – “cold air vortices”. These circumstances are essential for the formation of the initial data as there are frequent cases when Polar front active vortices smaller than 1000 km moved from the North to the observed region. Later, those vortices transformed into large scale cyclone.
Similar procedure on the initial data formation and its following statistic treatment were earlier performed for the North-Eurasian basin and the Kara Sea during the period 1981-1994 (Lagun and Loutsenko, 1996; Loutsenko, 1999). Taking into account the similarity of the geographical position of two Polar regions of the Northern and Southern hemispheres as well as chronological correspondence of the used satellite research, it seems of interest to compare the results of this research in the following article. Earlier the particularities of the mesoscale cyclogenesis in the Polar region atmosphere in the both hemispheres were compared by (Rasmussen, 1993; Turner and all,1993; Heinemann, 1995). The classification of the mesoscale vortices in the observed region of the Southern Ocean limited by 50° N was carried out on the basis of its shapes and the cloudiness structure. As it was in the Arctic region, besides the known shapes of the cloudy mesoscale vortices, comma and spiral-shaped ones, a third variety was set off - a strap-shaped one. The mesoscale vortices, composed by separate cloudy parts and the totality of small vortices lacking common center, were considered as such formations. Usually, these mesoscale vortices form over ice-free ocean surface along with the presence of cloudy fields, composed of open convective cellars together with a running of intensive cold Antarctic air.
Defining the degree of activity of the Antarctic subsynoptical cyclones in the field of pressure and wind is a difficult issue due to the lack of meteorological data on the sea level. It is difficult to separate the most active subsynopitcal cyclones as one of the mesoscale votices' types – “polar low”, on the analogy with Arctic regions. Therefore, the Arctic mesoscale vortices' intensity was defined in this case by the structure and brightness of the cloudy imagery on the satellite pictures. On the bases of these characteristics were defined two types of cloudy mesoscale vortices: the active ones, with well developed vertical dense cloudy structure, and the summer ones, consisting of weakly developed vertical stratusform cloudiness.
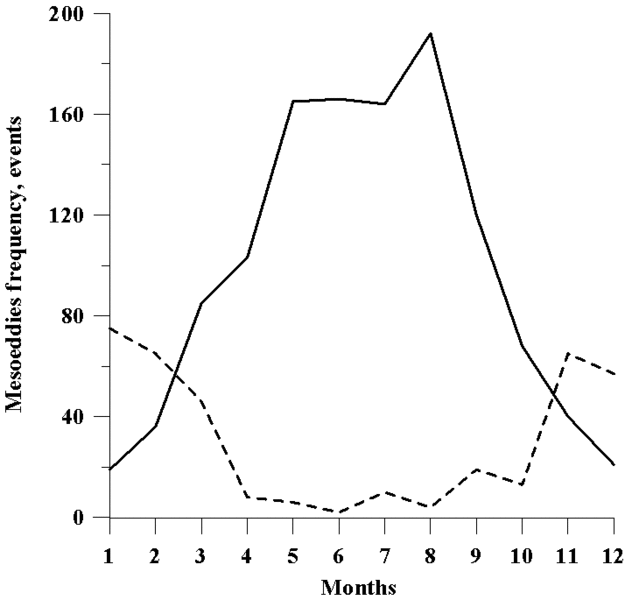
Figure 1 shows the frequency of active and summer mesoscale vortices on a monthly basis during the studied period. The maximum frequency of the active mesoscale vortices was pointed out during the year cold period, from May to August. The maximum quantity of the summer mesoscale vortices take place during the same months beginning from April. In a reverse order, during the summer period with a minimum frequency of active mesoscale vortices takes place the maximum of the summer ones. It is characteristic of active cloudy mesoscale vortices in the Southern Ocean atmosphere to form during the whole year, whereas over the Arctic Seas these types of formations appear characteristically only during the cold period. In Arctic secondary maximum of meso-scale eddy activity have been observed in April, but primary annual extreme witch origin in winter season as well as in Southern Polar area. Cloudy mesoscale vortices of summer type form in the Arctic atmosphere only during the summer period and even in this case its frequency is insignificant. Whereas in the Antarctic they form during the whole year over open water and over sea ice cover reaching high frequency during the summer period. Preliminary analysis proves that summer Antarctic mesoscale vortices may appear either during the cold air intrusion coming from the South on the Ocean surface in the baroclinic instability conditions, or in other synoptical situations.
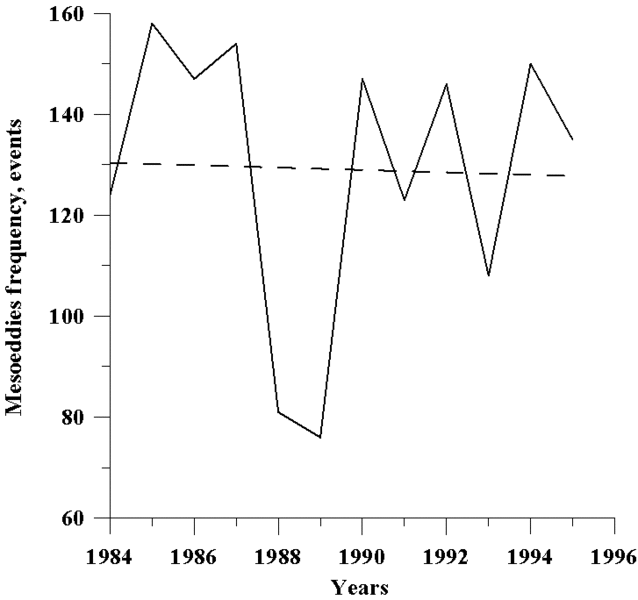
Figure 2 shows changes occurred during a few years period of the total number of cases of active and summer mesoscale vortices' formations in the studied
region. Minimum number of cases was recorded during 1988 and 1989 in an absence of a well marked maximum for a 12 years period. It is noticeable that the maximum number of mesoscale vortices was recorded in the studied Arctic region in 1988.
Spatial distribution of the cloudy mesoscale vortices on the atmosphere over Southern Ocean is generally characterized by its zone distribution. The Figure 3 shows the area distribution of the total number of mesoscale vortices, and, separately, the distribution of the active and summer ones respectively. The distribution if the total quantity of mesoscale vortices is characterized by the most expressed zone distribution. In this case the field of the maximum frequency is located along the 60° S. Possibly, the number of mesoscale vortices in the extreme Northern part of the studied region was partially reduced due to an inferior quantity of satellite pictures of this water area.
The distribution of the active cloudy mesoscale vortices is characterized by a presence of the maximum sector at the south-west of Enderby Land. It can be initially explained by a high frequency in this region of South winds in the low troposphere related with displasment of active Antarctic depressions to the shore during the year cold period. The maximum frequency of the summer type vorticies takes place in the shores of the ocean water area with two well marked maximum: in the region of the Prudz Bay and over the Riser-Larsen Sea. It may be explained by the presence in this region of important horizontal thermal contrasts during the year warm period. It should be remarked that in the Arctic region as well, the summer cloudy mesoscale vortices mainly form in the most high latitudes over the North-Eurasian basin.
The hydro-meteorological conditions, favorable to the development of the mesoscale cyclogenesis in the Southern Ocean atmosphere, are present during the whole year. Therefore the number of cloudy mesoscale vortices per area unity in the sector of its maximum concentration is, in this case, the double of the Arctic value. On the other hand, it can be stressed out that during the preliminary visual analysis of the initial data sub-synoptical mesoscale formations, characteristic of the Arctic seas, weren't pointed out. Here are particularly mentioned polar mesoscale cyclones, which form in the direction of the South-West Svalbard crossing Barents Sea with noticeable speed.
All the above mentioned proposals and issues need further investigation of this topic while using more hydro-meteorological information.
References
Carleton, A. M., and Y. Song, Synoptic climatology, and intrahemispheric associations, of cold air mesocyclones in the Australasian sector, J. Geophys. Res., 102, 13873-13887, 1997.
Carrasco, J. F., and D. H.Bromwich, Climatological aspects of mesoscale cyclogenesis over the Ross Sea and Ross Ice Shelf regions of Antarctica, Mon. Weather Rev., 122, 2405-2425, 1994.
Carrasco, J. F., and D. H.Bromwich, Mesoscale cyclogenesis dynamics over the southwestern Ross Sea, J. Geophys. Res., 98, 12973-12995, 1993.
Carrasco, J. F., and D. H.Bromwich, Mesoscale cyclone activity near Terra Nova Bay and Byrd Glacier, Antarctica, during 1991, Global Atmos. Ocean. Syst., 5, 43-72, 1996.
Heinemann, G., Polare mesozyklonen. Bonn. Dummlere Verlag. 151 s., 1995.
Lagun, V. E., and E. I. Loutsenko, Diagnosis, typification and climatology of the polar cyclones and other mesoscale vortex formations above North-Eurasian basin and the Barents Sea, Sixth meeting of the EGS Polar Lows Working Group. St. Petersburg, 23-26 September, 1996. P. 18-19.
Lieder, M., and G. Heinemann, A Summertime Antarctic Mesocyclone Event over the Southern Pacific during FROST SOP-3: A Mesoscale Analysis Using AVHRR, SSM/I, ERS and Numerical Model Data, Weather and Forecasting, 14, 893-908, 1999.
Loutsenko, E. I., Satellite mesoscale cyclogenesis over the Arctic Seas, AARI Proceeding, 441, 202-213, 1999.
Rasmussen, E. A., Northern and Southern Hemispheric Polar Lows – a comparative study, Acta Meteorologica Sinica, 7, 355-366, 1993.
Turner, J., T. A. Lachlan-Cope, and J. P. Thomas, A comparison of Arctic and Antarctic mesoscale vortices, J. Geophys. Res., 98, 13,019-13,034, 1993.
Please click on the images for full resolution or animation.