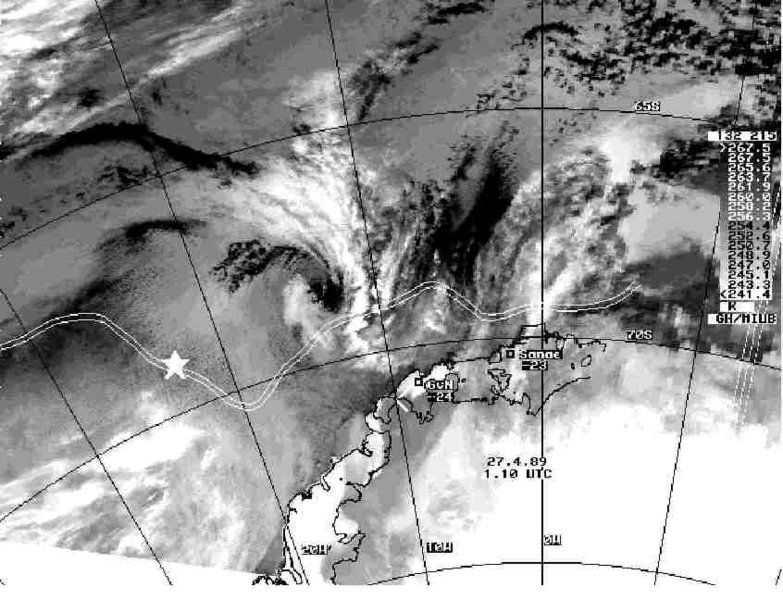
Polar low development at the sea ice edge near the coast 27-28 April 1989
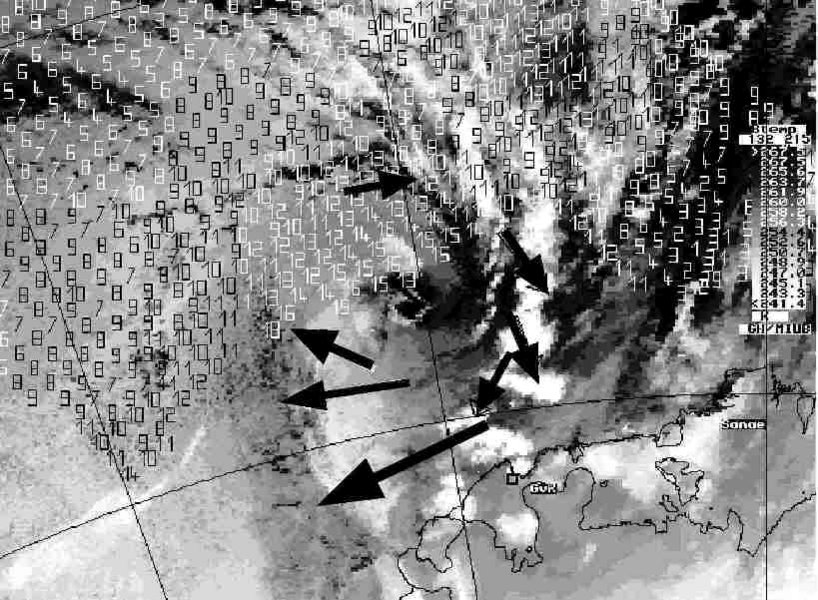
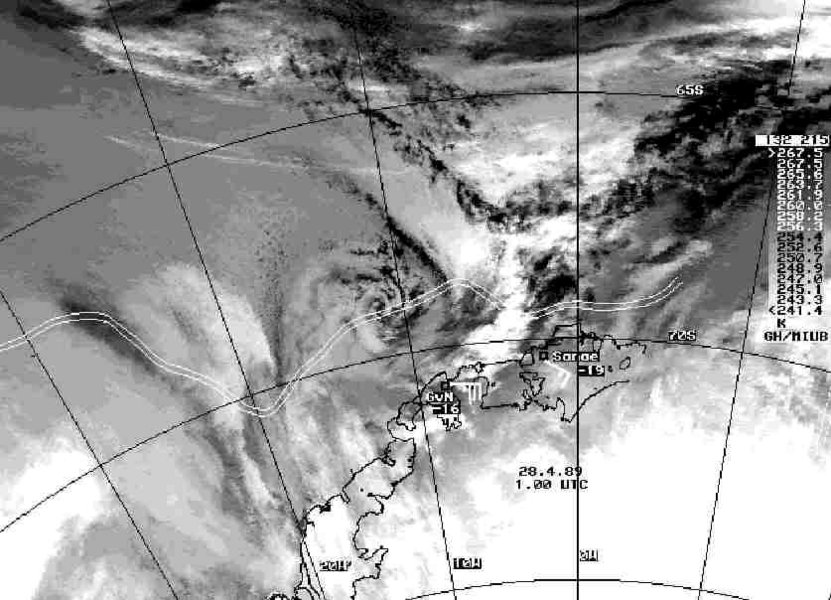
The baroclinic development of an intense MC over the Weddell Sea near the Antarctic coast close to the German Georg-von-Neumayer Station (GvN) took place during the period 26-28 April 1989. This case was studied by Heinemann (1996a/b) by means of satellite and conventional data, ECMWF analyses, radiosonde data, and surface observations. The MC had a diameter of about 500 kms, a lifetime of about 40 hours and reached the intensity of a polar low. Wind speeds up to 19 m/s (with gusts up to 24 m/s) were recorded at GvN as the MC approached on 27 April and remained quasi-stationary for about 24 hours. Its development took place in baroclinic conditions of strong low-level cold air advection close to the sea ice front. The genesis of the MC seemed to be triggered by a 500 hPa short-wave trough and a resemblance to a baroclinic development at a boundary layer front was noticed. Low-level thickness fields from TOVS data reflected the baroclinic structure of the MC, but gradients were relatively weak. Wind speed retrievals from SSM/I data did not allow a full analysis of the wind field structure for this case as they were limited to ice-free ocean. They showed the incipient MC lying in an area with increased wind speed and high surface fluxes of sensible heat. In the mature stage, a maximum in the SSM/I wind speed field was found in the northwestern part of the MC. A meso-scale analysis with a limited area assimilation system for the mature stage showed only weak support of the low-level MC by upper level cyclonic vorticity advection.
References:
Heinemann, G., 1996a: On the development of wintertime meso-scale cyclones near the sea ice front in the Arctic and Antarctic. Global Atmosphere-Ocean System 4, 89-123.
Heinemann, G., 1996b: A wintertime polar low over the eastern Weddell Sea (Antarctica): A study with AVHRR, TOVS, SSM/I and conventional data. Meteor. Atmosph. Phys. 58, 83-102.
Please click on the images for full resolution or animation.
Copyright by Günther Heinemann.