Topographically forced mesocyclones in the Ross Sea region of Antarctica 1988
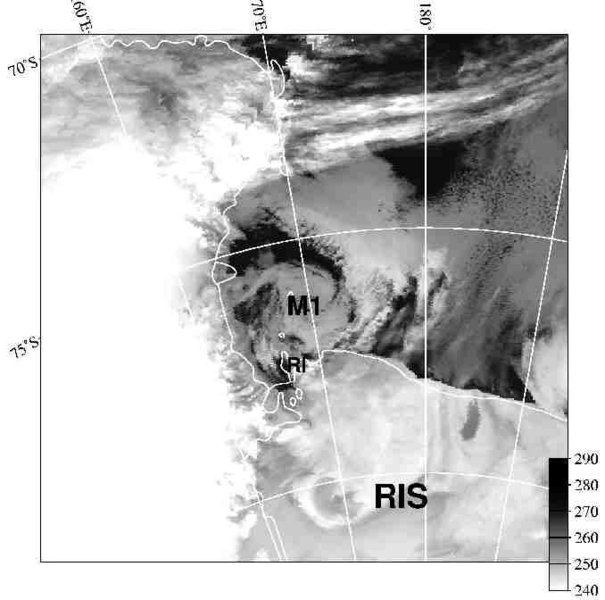
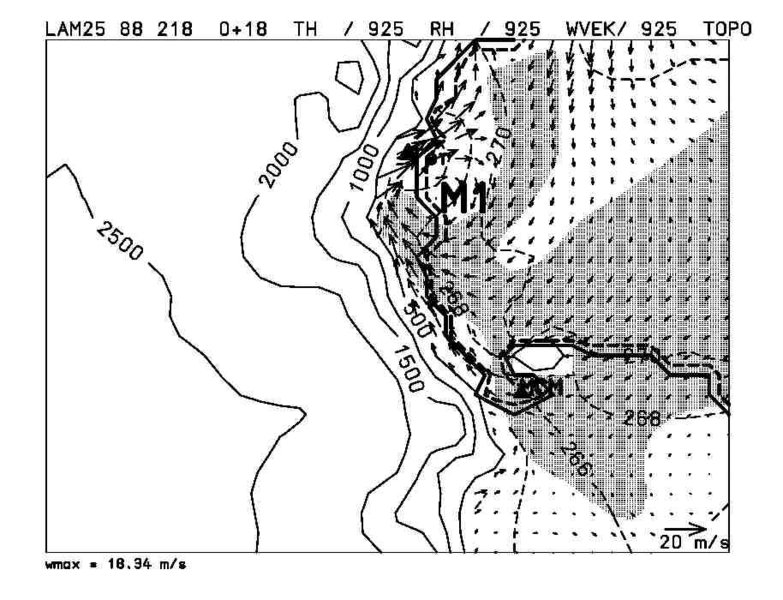
The complex Antarctic topography of the coastal regions can play an important role in mesocyclogenesis. In the Ross Sea region the topographic structure along the coast leads to a significant channeling of the katabatic boundary layer winds. In connection with additional synoptic forcing, the vertical stretching of the converging flow leads to a production of cyclonic vorticity. Besides this stretching mechanism, katabatic winds can have a second impact on the generation of MCs by transporting cold air into the coastal areas and thereby enhancing the low-level baroclinicity. Climatologies mainly based on satellite imagery show that MCs occur frequently in the Ross Sea region of Antarctica (Carrasco and Bromwich 1994). The case of 18 February 1988 is a good example of the interaction of katabatic winds and MCs in the areas of Terra Nova Bay and McMurdo, and have been studied using observations by Bromwich (1991) and Carrasco and Bromwich (1993, 1995) and by Heinemann and Klein (2001) using mesoscale model simulations.
References:
Bromwich, D. H., 1991: Mesoscale cyclogenesis over the southwestern Ross Sea linked to strong katabatic winds. Mon. Wea. Rev. 119, 1736-1752.
Carrasco, J. F., and D. H. Bromwich, 1994: Climatological aspects of mesoscale cyclogenesis over the Ross Sea and Ross Ice Shelf regions of Antarctica. Mon. Wea. Rev., 122, 2405-2425.
Carrasco, J. F., Bromwich, D. H., 1995: A Midtropospheric Subsynoptic-scale Vortex that developed over the Ross Sea and Ross Ice Shelf of Antarctica. Antarctic Sci., 7, 199-210.
Heinemann, G., Klein, T., 2001: Simulations of topographically forced mesocyclones in the Weddell Sea and the Ross Sea region of Antarctica. Submitted to Mon. Wea. Rev.
Please click on the images for full resolution or animation.
Copyright by Günther Heinemann.